Red Zone Target Share and NFL Player Props: Finding the Real TD-Scoring Edges
 Available in US
The play I rewound twelve times before I understood it
The Super Bowl LIX touchdown I remember most clearly was a one-yard run that looked exactly like the other one-yard touchdowns the same team had scored that season. The thing that interested me about it was not the play itself. It was the fact that, looking at the touchdown distribution from the last 35 Super Bowls, a touchdown scored from inside the 1-yard line had happened in 24 of them – about 60% of championship games, and 4 of the last 5. That is not a coincidence. That is structural information about how NFL offences score, and it is the kind of information that should reshape how anybody bets touchdown props.
The red zone is its own world. Down there the playbook shrinks, the routes shorten and the target tree collapses. Knowing who is actually being targeted inside the 20 – and inside the 10 in particular – is the single most useful piece of information for anyone playing anytime TD and goal-line touchdown markets.
Where the data actually lives
Red zone target share is one of the public stats that has become genuinely easy to find. The major NFL analytics outlets break it out by team, by player, by season and by individual game. What is harder is interpreting it. A 25% red zone target share over a full season is meaningful. The same 25% share built off a sample of 12 red zone snaps is essentially noise – you cannot extrapolate from a small sample, and yet the headline number reads the same.
The threshold I work with is 30 red zone snaps before I treat any individual player’s share as predictive. Below that, I look at role, scheme and goal-line personnel groupings instead of the percentage. The role-and-scheme read is harder because it requires watching film, but it is more reliable on small samples than any single statistic. A tight end who is reliably the goal-line third receiver in 12-personnel is a goal-line target regardless of what his red zone target share has been over four games.
What I avoid is reading red zone receptions as a substitute for red zone targets. Receptions are catch-rate filtered, and red zone catch rates are noisy because passes get knocked down at the goal line more often than they do at midfield. Targets – the number of times the QB threw the ball in a player’s direction inside the 20 – is the cleaner indicator of intent.
Goal-line backs versus three-down backs
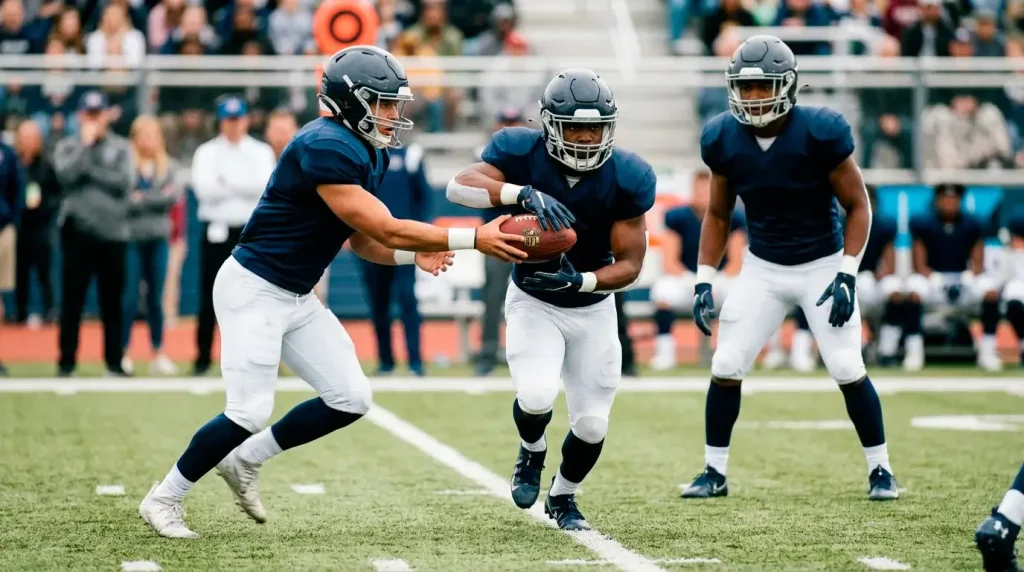
The most important workload split in modern NFL backfields is the goal-line carry distribution. Some teams run a single-back system where the lead RB takes virtually every red zone carry. Others split it – a power back inside the 10, a third-down receiving back outside the 10. The implications for prop bettors are direct: in a single-back system, the starting RB’s anytime TD line is a clean function of team goal-line attempts. In a split system, the line is fragmented across two players, each at a longer price.
The split-system trap is taking the longer odds on the power back without checking whether the team is in goal-line situation often enough for the role to translate to touchdowns. A power back who gets the carry from the 1-yard line, twice a game, on a team that scores 14 points a week, is a worse anytime TD bet than his +180 price suggests. The volume of one-yard-line opportunities for his team is the gating variable, not his role within those opportunities.
The single-back system, conversely, often produces shorter prices than the data deserves. A bell-cow back on a team that scores 28 points a game gets the goal-line carries by default, and his anytime TD price reflects that – but his receiving-touchdown upside, which sometimes adds a meaningful extra path to the prop cashing, is layered on top without the market always pricing it cleanly. UK bookmakers tend to focus on rushing-TD probability for backs, and the receiving-TD path adds genuine edge to the over.
Tight ends in the red zone are their own market
The tight end position has more red zone target share variance than any other receiving role. Some tight ends are pure mismatch weapons inside the 10 – bigger than a corner, faster than a linebacker – and their teams scheme red zone passing concepts around them. Other tight ends are blocking specialists with token receiving roles, and their red zone target share is functionally zero.
The distinction matters because anytime TD prices on tight ends span a wide range. A mismatch TE on a high-scoring offence might price at evens or shorter. A blocking TE on the same team is +800 or longer. The middle of the distribution is where the market gets messy – backup tight ends, rotational players in 12-personnel groupings, who can occasionally score but whose red zone target share is too low and too noisy to bet on confidently.
What I look at for tight end TD props is the team’s red zone passing rate against the position’s red zone target share within that. A team that throws 50% of its red zone plays, and directs 30% of those throws at the tight end, is producing meaningfully more TE red zone targets than the headline yards-per-game stat suggests. That is the player whose anytime TD price has structural support. The player on the same depth chart whose red zone targets are zero is a price trap regardless of overall production.
Combining red zone data with TD props
The reason red zone data matters more for TD props than for yardage props is that touchdowns happen overwhelmingly inside the 20-yard line. Yardage accumulates across the field; TDs concentrate in 20% of the playing surface. A receiver who produces 80 receiving yards a game on midfield routes is a yardage-over candidate but not necessarily a TD candidate. A receiver who produces 50 yards a game with high red zone target share is the other way around.
The cleanest spots I find are players who have outsized red zone roles on teams that score a lot. The compounding effect – high red zone target share multiplied by lots of red zone trips – pushes anytime TD probabilities meaningfully above what the surface stats imply. The market sometimes adjusts to this, but slowly. Anytime TD prices on second-tier receivers on high-scoring teams are often longer than their actual hit rate would justify.
The trap that costs me the most is the long-shot anytime TD on a slot receiver in a high-scoring offence. The slot guy gets short targets that are great for catch volume but rarely produce touchdowns – a slot receiver’s red zone target share is often lower than his overall target share, because his usual route tree (slants, drags, sit routes) gets compressed in tight space. The slot’s TD upside is real but smaller than the headline volume suggests, and the prices rarely compensate for that. Odds Shark’s Nick Holz framed his approach to championship-game props simply: “My favourite Super Bowl 60 betting nugget is that the top team by defensive and total team DVOA has advanced to the Super Bowl four times in the last 40 years.” That same logic – looking at the structural feature, not the surface stat – is what red zone target share gives you on TD props.
Combining red zone reads with broader prop construction
The way I integrate red zone data into a Sunday slate is sequential. I start with the team-level question – which offences are likely to be in the red zone often, given their scoring projection and the matchup? I then move to the depth-chart question – within those offences, who has the highest red zone target share and the cleanest goal-line role? Only then do I look at prices and decide where the value is.
The mistake most prop bettors make is starting with the player and working backwards. They like a player, they look at his anytime TD price, they decide whether it is value. That order rewards bias. Starting with team-level red zone volume and filtering down to the player with the cleanest role inside that volume produces a list of TD prop candidates that often does not include the names anybody is talking about, which is exactly what you want.
The 60% Super Bowl one-yard-touchdown rate is, in a way, the cleanest illustration of why this works. The biggest scoring play in the biggest game is overwhelmingly a function of structural roles – who is the goal-line guy – rather than season-level talent. The prop market on individual Super Bowl players reflects this imperfectly, which is why goal-line backs are often the value play on Super Bowl anytime TD markets even at short prices.
Which red zone target threshold reliably correlates with shortened anytime TD odds?
A red zone target share above 25% over a sample of 30 or more red zone snaps is the rough threshold where bookmakers start pricing the player at clearly shorter anytime TD odds. Below that share, the role is too diluted to predict touchdowns reliably. Above it, the player is being deliberately schemed for in red zone situations, and the market generally reflects this within a half-season.
Are tight ends or slot receivers a better red zone TD bet historically?
Tight ends, on average, because their red zone target share is structurally higher and their bigger frame creates mismatch advantages inside the 10. Slot receivers run route trees that produce volume across the field but rarely concentrate near the goal line. The qualification is that not every tight end is a red zone weapon – the blocking specialists at the position are essentially zero-TD prospects regardless of overall snap share.
Once you have the red zone read working as a filter, the next layer to add is how anytime TD props correlate with passing and receiving legs inside a same-game parlay.
This material was created by the YardLedger team.
Related posts

Passing Yards Prop Strategy for NFL: Reading Lines, Pace and Defensive Context
NFL RB Committee Prop Strategy: How to Bet Backfields That Refuse to Anoint a Workhorse