NFL RB Committee Prop Strategy: How to Bet Backfields That Refuse to Anoint a Workhorse
 Available in US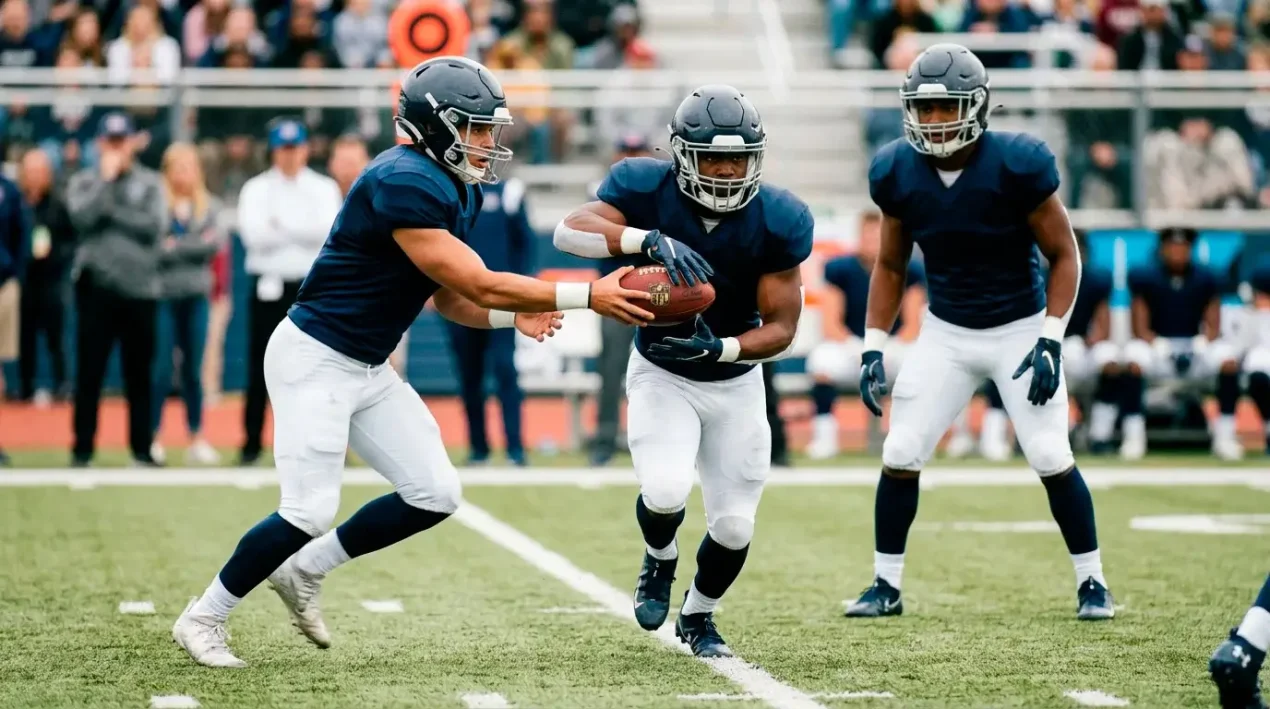
The bet I made on the wrong half of a tandem
An NFC South backfield three seasons ago looked, on paper, like a clean prop opportunity. The starter was averaging 14 carries a game, the line was set at 62.5 rushing yards, and the matchup was a defence ranked 28th against the run. I bet the over. He carried the ball 7 times for 24 yards before the second-quarter clock-control script kicked in. The other half of the committee – the change-of-pace back I had not even glanced at – got 11 carries for 78 yards including a 34-yard touchdown burst. The committee split had completely flipped because the game flow had flipped, and I had paid for not noticing.
That experience drove home a lesson that has shaped how I evaluate running back props ever since. The committee backfield is not a worse version of a workhorse backfield. It is a categorically different prop-betting problem, and the analytical framework that works for Christian McCaffrey or Saquon Barkley does not work for the split-touch tandems and three-headed monsters scattered across the league. Getting committee props right is one of the largest sources of edge available to UK NFL punters, because committee misreads are also one of the largest sources of casual-bettor losses.
What committee actually means in 2026
The NFL’s backfield landscape has shifted in the past several seasons toward more committee structures and fewer workhorses. The number of running backs receiving 70% or more of their team’s carries has declined to roughly a dozen across the league. Most teams now run some version of a two-back rotation, with carry shares of roughly 60/30 or 55/40 depending on script. A handful of teams use three-back rotations where no single back exceeds 45% of the snaps.
The prop market has not fully adjusted to this structural change. Rushing-yards lines on the lead back of a 55/40 committee are often set as if the back is a 70%-share workhorse, which inflates the line by 15 to 20 rushing yards relative to true expected production. Conversely, rushing-yards lines on the secondary back are often set in line with their season-average production, which fails to account for matchup spots where the script will favour their style and elevate their share of touches above the season average.
The interesting case is the three-back rotation, where the lead back’s prop is sometimes inflated, the change-of-pace back’s prop is set near his season average, and the goal-line specialist’s anytime-TD price is wide of his true probability. The committee structures where the lead back’s carries are not protected by clear-cut role definition are the spots where the under on the lead back’s rushing yards is consistently underpriced.
The script-driven committee split
The single biggest determinant of how a committee splits in a given game is the game script. Teams playing from ahead lean on their power back. Teams playing from behind switch to their change-of-pace, pass-catching back. Teams in close games oscillate based on situation – first and second down to the power back, third down and two-minute drill to the receiving back.
The implication for prop betting is that the committee split is downstream of the spread and the projected game flow. A favoured team’s lead back gets a script-driven boost to his share of the workload, as the second-half clock-control phase elevates his carries. A heavy underdog’s lead back gets a script-driven cut, as the team abandons the run earlier than the season-average rate. The lines should incorporate this, and on the largest spreads they do, but the middle of the spread distribution (3.5 to 6.5 point favourites) is where committee-prop misalignment shows up most consistently.
The Pickswise prop ledger that ran to 59 winning props and +7.7 units across the regular season and three playoff rounds had a meaningful contribution from script-driven committee plays: lead-back overs on moderate favourites, change-of-pace overs on moderate underdogs, and pass-catching back receiving-yards overs in projected come-from-behind spots. The pattern is consistent enough that it has become one of the more reliable structural edges in the prop market.
The injury and inactives multiplier
Committee backfields amplify the impact of injury news. When the lead back of a workhorse backfield is ruled out, the prop on his replacement is moved aggressively but predictably – the backup steps into the elevated role and the line reflects that. When the lead back of a committee is ruled out, the situation is more complex. The remaining backs sometimes split the carries differently than their season pattern, the team sometimes elevates a third-string back to active duty, and the new committee structure can take a few series to settle.
The implication is that the Sunday morning prop adjustments around inactives are most aggressive in the workhorse cases and most lagged in the committee cases. The lagged adjustments are where UK punters with the right Sunday morning workflow find clean spots. A starting committee back ruled out at 12:30 UK time, with the change-of-pace back’s prop line not yet repriced to reflect his elevated role, is a near-mechanical over opportunity if you can catch the line in the 30-to-60 minute window before the market fully adjusts.
The 1.2 million UK NFL searches per month spike sharply on Sunday mornings, partly because of injury news cycles and partly because UK punters are checking lines that just moved. The committee injury news is the highest-leverage information in that window, because the prop adjustments are the largest and the market-adjustment lag is the longest. The competitive structure of UK books means some operators move on this news within 15 minutes; others take 90 minutes or longer.
The pass-catching back’s specific value
Pass-catching backs occupy a unique structural position in the prop market. Their rushing yards are often modest (40 to 60 per game), but their receiving yards can be substantial (30 to 60 per game), and the combined-yardage market sometimes prices them as if they were a rushing back rather than a hybrid. The receiving-yards line on a true pass-catching back is often the cleaner play than the rushing-yards line, because the volume of targets is heavily script-driven and therefore predictable.
A pass-catching back’s receiving-yards over performs best in games where the team is projected to trail. Pass-catching backs see their target share spike when offences shift to dump-off and check-down passing in catch-up mode. The receiving-yards line, which is often set in the 25 to 35 range, tends to undershoot the actual production in negative-script spots by 10 to 15 yards. The bet has the additional advantage of being relatively variance-stable – receiving yards for a pass-catching back are accumulated across 5 to 9 targets in a typical game, which is a less volatile volume than rushing yards built from 12 to 16 carries.
The Pro Football Focus and similar tracking sources publicly identify each team’s pass-catching back share by route participation rate. Backs running routes on more than 65% of their team’s pass plays are the ones whose receiving-yards lines deserve close attention in projected negative-script games. The matchup-specific factor – opposing linebacker coverage quality – adds further dispersion to outcomes but is harder to translate into line value because the books incorporate it inconsistently.
The goal-line back angle
Goal-line specialists in committee backfields represent a specific prop opportunity that does not fit cleanly into rushing-yards or receiving-yards markets. The anytime-TD price on a goal-line back can be substantially mispriced because his per-game touch count is low (maybe 5 to 8 carries) but his red-zone carry share is high (60% or more of the team’s goal-line work). The result is a player with limited yardage upside but disproportionate TD probability.
The structural fact that drives this: 24 of the last 35 Super Bowls have featured a touchdown scored from the 1-yard line, around 60% of championship games. The 1-yard-line carry is the most common scoring play in the highest-leverage games in football, and the player who takes it is typically the goal-line back, not the lead back of a committee. The anytime-TD price on a goal-line back is often set in the +180 to +250 range, implying a 28% to 36% probability. The true probability, in plus-matchup spots where the team is projected to reach the red zone three or more times, is often closer to 40%-45%.
Henry Hodgson, the NFL UK GM, has framed the broader engagement trajectory: “There’s a lot of growth, and the UK is at the centre of that international growth as well.” That growth flows disproportionately into long-shot markets like anytime-TD and first-TD-scorer, which are the markets where casual UK punter volume has expanded fastest. The compensating opportunity for the disciplined bettor is that the inefficiencies in goal-line-back pricing – under-recognised by casual public money – have persisted even as the market grows.
The committee-vs-workhorse routing of bets
The practical decision framework I use on a Sunday is to first sort the slate’s running backs into three categories: workhorses (70%-plus share), lead-of-committee (50% to 70% share), and committee specialists (under 50% share). The workhorse rushing-yards markets are the most efficiently priced and the spots where matchup edge is hardest to find. I will play workhorse markets only when there is a clear matchup edge (top-tier rush defence mismatch, weather-driven script alignment, or post-injury elevation creating a new workhorse).
The lead-of-committee rushing-yards markets are where the inflation problem shows up most often. I default to the under on these unless the script alignment is unusually clean. The committee specialist markets – pass-catching back receiving yards, goal-line back anytime TD – are where my Sunday bets concentrate, because the structural mispricing is largest and the analytical effort to identify the right spots pays the cleanest dividends.
The sizing follows the same routing. Workhorse rushing-yards bets at 2% of bankroll when the edge is clear. Lead-of-committee under bets at 1.5%, reflecting slightly higher variance. Committee specialist plays at 1% to 1.5%, sized smaller because the lines are sometimes available at multiple books and a parlay-style spread of small positions captures more of the upside than a single large bet. Over a season, the committee specialist line of plays has been my highest-ROI category by a meaningful margin, even though it contributes a smaller share of total stakes than the workhorse line.
How do I identify when an NFL RB committee will produce a lead-back over?
The two clearest signals are a moderate spread favouring the team (3.5 to 7 points) and a projected total in the 42-to-48 range. Those conditions mean the team is favoured enough that positive game script will elevate the lead back’s carries in the second half, but not so heavily favoured that the game is decided by halftime. The lead back’s carry share in this band typically climbs from his season-average 55% to closer to 65%, which is the swing that converts a marginal over into a confident one. The compounding factor is opposing rush defence quality below league average.
Is the pass-catching back’s receiving-yards prop a better play than his rushing-yards prop?
In most cases yes, particularly in games where the team is projected to trail. Pass-catching back receiving yards are accumulated through 5 to 9 high-percentage targets per game, which is less variance-prone than rushing yards built from 8 to 12 carries. The market often prices both lines as if the back were a balanced contributor, when in reality his receiving production is more predictable and more script-driven. The cleanest spots are pass-catching backs with route participation rates above 65%, in projected negative-script games against soft linebacker coverage.
If committee thinking sharpens your interest in markets where script dictates outcome more than raw talent does, the related read is how QB rushing-yards props convert mobile QBs from luxury into reliable prop tools.
This material was created by the YardLedger team.
Related posts

Passing Yards Prop Strategy for NFL: Reading Lines, Pace and Defensive Context
Jet Lag and NFL London Games: How Travel Shifts Player Prop Lines