NFL Defence and Special Teams Props: Sacks, Interceptions and Return Yards on UK Books
 Available in US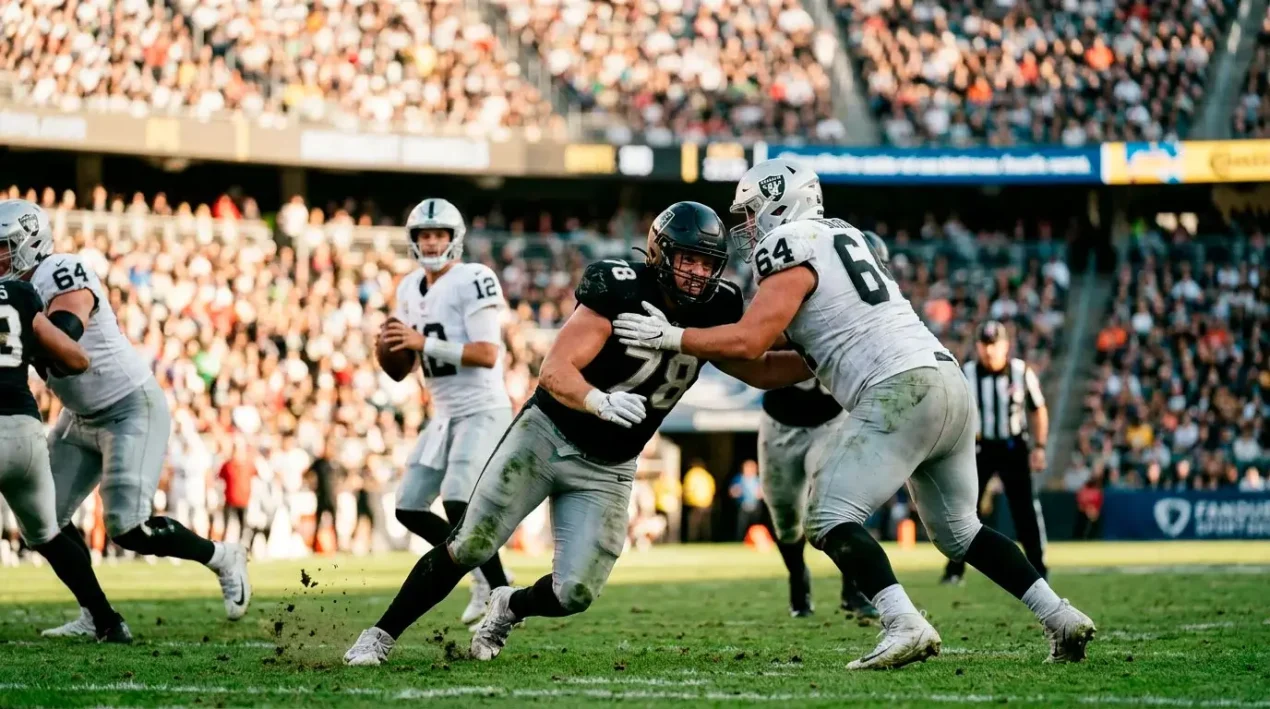
The sack market that paid for my coffee for a season
Two seasons ago I started keeping a running tab on edge-rusher sack props. I picked the four edges I rated most reliably and tracked their sack-over line every week against my own projections. By Week 10, the cumulative P&L on those four players’ sack overs was substantial enough that I no longer thought of edge sacks as a curiosity market. They had become a more consistent contributor to my season than any single skill-position market I was running.
The reason, when I unpicked it, was that defensive and special-teams prop markets are systematically less efficiently priced than offensive skill markets on UK books. The casual punter volume is smaller. The analytical inputs are more specialist. And the underlying performance metrics for defensive players (pressure rate, snap counts, opposing offensive line quality) are slower-moving than the offensive skill stats that drive the headline markets. That combination – thinner market, slower-moving inputs, lower attention – is the structural setup for a punter willing to put in the prep.
Edge rusher sack props and the matchup that matters
Sack props are typically offered at 0.5 (over/under one sack) and occasionally at 1.5 for the most prolific pass-rushers. The 0.5 line is the volume market and the one where line shopping matters most. The implied probability of “one or more sacks” varies enormously by player and matchup, from around 35% for a borderline starter to 65%-plus for an elite edge rusher in a plus matchup. The price the book offers should reflect that range, but in practice the lines compress around -120/-115 across most edges, which leaves consistent value for the bettor who can identify the genuine 60%-plus spots.
The matchup variables that drive sack probability are knowable and stable. Opposing offensive tackle pass-protection metrics, particularly pressure rate allowed and pass-block win rate against speed rushes, are tracked publicly through the season. A top-tier edge rusher facing a bottom-five offensive tackle in pass protection has a true sack probability that comfortably exceeds the implied 54% break-even rate at -120. The same edge rusher facing a top-five tackle has a true probability somewhere in the 45%-50% range, where the price is no longer attractive.
The Pickswise prop ledger that ran to 59 winning props and +7.7 units across regular season, wild card, divisional and conference rounds had a notable concentration of edge-rusher sack overs in matchups where the tackle was the weak link. The structural insight is not exotic – pick edges in plus matchups against weak tackles – but executing it consistently requires the weekly discipline of cross-referencing pressure rate data with the betting lines, and most casual punters do not maintain that habit.
Interception props and the QB factor
The defensive interception prop market is more volatile than the sack market because interceptions are lower-frequency events. League-wide, the average defender records around 2 to 3 interceptions per season, which means the per-game probability for any individual defender is small. The market typically offers interception props only on the most active ball-hawks – high-snap-count safeties and corners with a history of takeaways.
The cleaner way to play interception markets is the team-level interception prop, when offered. A team’s interception probability per game is much higher than any individual defender’s, and the matchup variables that drive it (opposing QB turnover-worthy throw rate, opposing offensive line pass-block quality, QB performance under pressure) are stable and identifiable. The interception markets at the team level often offer 0.5 lines that are correctly priced around the true probability, but the over alt lines (1.5, 2.5) sometimes lag the matchup-specific factors.
The QB factor that punters under-weight: turnover-worthy throw rate is meaningfully season-stable for most QBs, and the QBs at the high end (over 3% of attempts) are the ones who drive interception props on opposing defences. A defence facing a high-turnover-rate QB at home, with their best ball-hawk corner active, is the structurally cleanest defensive interception over spot. The reverse – a defence facing a low-turnover QB on the road, with key starters in injury risk – should typically be skipped regardless of how the public line looks.
Tackle props and the volume game
The tackle prop market is the highest-volume defensive market on UK books, but it is also the most efficiently priced because tackle counts are heavily snap-count-driven and therefore predictable. A starting middle linebacker with 95% snap share has a typical tackle range of 8 to 12 per game, and the line will reliably land in the middle of that range. Beating the tackle line consistently requires either a snap-count edge (a backup who is suddenly elevated to starter) or a script edge (a game projected to skew run-heavy, increasing front-seven defender tackle volume).
The snap-count edge is the cleaner of the two. When a starting linebacker is ruled out and his backup is elevated to full snaps, the backup’s tackle prop line typically does not adjust by the full proportional amount. A backup who normally plays 30% of snaps and averages 3 tackles, suddenly playing 95% of snaps, should have a projected tackle line in the 9 to 10 range. UK books often set the line in the 6.5 to 7.5 range in this scenario, particularly when the elevation is confirmed close to kick-off. The over is one of the cleaner injury-driven prop plays available.
The script edge requires more work. A game projected to skew heavy-rush – a cold-weather outdoor matchup, a high-pace rushing offence facing a soft run defence – increases the snap share of the run-defending linebackers. Their tackle counts go up correspondingly, but the prop line often does not reflect the script-driven volume increase. The script angle works best when paired with weather and matchup conditions that confirm the run-heavy projection.
The kick and punt return markets that exist
Return-yard props are the least-watched market on most UK books, which is exactly why they sometimes produce the largest line inefficiencies. The market typically offers total return yards over/under for designated kick or punt returners on each team, often at lines that have not been heavily updated through the week. The base rate is heavily script-driven: a team that is trailing for most of the game receives more kickoffs, which creates more return opportunities. A team that is winning comfortably punts often, which creates punt return volume for the opposing team.
The implication is that return-yard props are essentially leveraged bets on game flow, which makes them most valuable when you have a clear view on which team is likely to be playing from behind. A heavy underdog facing a high-powered offence in poor weather might receive 6 to 8 kickoffs, with a return man’s expected return yardage running closer to 150 than the typical 75. The lines on these spots are often set conservatively because the books are not modelling extreme-script variance.
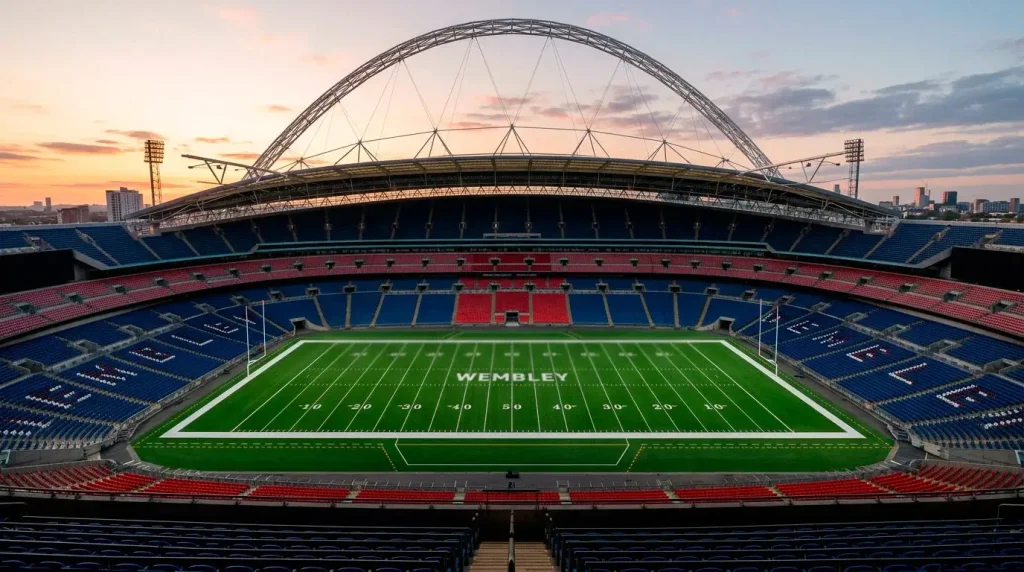
The 2026 international slate of nine games adds further inefficiency to the return market. The pitch dimensions and kick-off coverage characteristics at Wembley, Tottenham Hotspur Stadium, Croke Park, Berlin, Madrid and the other international venues differ from US stadiums in ways that affect kick coverage angles. Special-teams coaches do scout these venues, but the historical sample of returns at international venues is small enough that the books do not have a strong prior on how returners perform. The result is wider line dispersion across books and more opportunity for the punter to find the soft side.
The defensive TD market and the dollar-cost insurance angle
The “anytime defensive touchdown” market is a recreational long-shot product that should be evaluated on its variance characteristics rather than its expected value. The implied probability of any single defensive TD in a given game is around 7% to 10%, and the price the books offer (typically +900 to +1200 for any specific defence to score a TD, or +400 to +500 for “any defensive TD in the game”) is roughly aligned with the true probability after vig.
The structural use of the defensive TD market for disciplined punters is as a hedge or insurance against a specific scoring scenario. If your main bet on the game is a passing-yards over on the QB, a defensive-TD parlay leg adds a low-cost catastrophe hedge – if the QB throws a pick-six early and gets benched, your defensive TD long shot would cash and partially offset the lost main bet.
The structural use that does not work is treating defensive TD props as standalone value bets. The variance is too high relative to the price, and the base rate is too low for any matchup-specific factor to move the true probability enough to create durable edge. UK NFL bettors saw a 65% year-over-year increase in NFL prop volume after the 2024/25 season according to Entain’s reporting, with stakes up 46%, and a portion of that growth has flowed into long-shot defensive TD markets. Henry Hodgson, the NFL UK GM, has noted: “There’s a lot of growth, and the UK is at the centre of that international growth as well.” That growth has compressed the obvious edges in skill-position markets faster than it has compressed defensive markets, which is why defensive and special-teams props remain a relative-value sweet spot for the disciplined bettor.
The unified workflow for defence and special-teams selection
My weekly defensive prop workflow follows a different rhythm from my skill-position work. The skill-position bets come together by Friday because the inputs are weekly. The defensive bets come together earlier – sometimes by Wednesday – because the matchup-driven defensive factors (tackle quality, pressure rate disparities, opposing QB profile) are more stable than week-to-week skill projections. I lock my defensive selections by Friday afternoon and rarely adjust them through the weekend except for confirmed injury news.
The selection filter for sack props: top-eight pass-rushers facing bottom-eight pass-protection tackles, with no injury concerns on the rusher. The filter for tackle props: starters with snap-count elevation due to confirmed injuries, with games projected to skew run-heavy. The filter for return props: kick and punt returners on heavy underdogs in projected low-scoring affairs.
The sizing discipline matches the variance characteristics of each sub-market. Sack props sized at 1.5% to 2% of bankroll. Tackle props sized at 1% to 1.5%, lower because the edges are smaller and the line precision is higher. Return props sized at 1%, because the variance is high and the snap of game-script can move outcomes substantially. Defensive TD plays sized at 0.5% or less, treated as variance plays rather than core positions. Across a typical Sunday slate, my defensive and special-teams positions account for around 25% of total stakes deployed but a disproportionately larger share of season-long net positive contribution to bankroll.
Are NFL defensive player prop markets worth the analytical effort for UK punters?
Yes, especially sack and tackle props for selective spots. Defensive markets are less heavily bet by casual punters and the lines are less aggressively tightened than skill-position markets. The structural edge for a punter willing to track pressure-rate matchups, snap-count elevations and projected script is meaningfully larger than for the equivalent effort on QB and WR markets. The trade-off is that the per-bet ceiling is lower, so the playstyle suits a base-layer rhythm of consistent small wins rather than variance-driven big wins.
How do I identify edge-rusher sack prop overs that are mispriced?
The clearest signal is a top-tier edge rusher matched up against a bottom-tier offensive tackle in pass protection. Public pressure-rate and pass-block win-rate data identifies these matchups before kick-off. When the offered price is at -120 or shorter and your matchup analysis projects the rusher’s true sack probability above 60%, the bet has clean structural value. The play is most consistent when the opposing offence is also projected to face frequent passing situations, which increases the sample of pass-rush opportunities.
If defensive thinking sharpens your interest in markets where matchup work creates compounding edge, the related read is how systematic line shopping across UK operators converts analytical edge into actual P&L.
This material was created by the YardLedger team.
Related posts

Passing Yards Prop Strategy for NFL: Reading Lines, Pace and Defensive Context
NFL RB Committee Prop Strategy: How to Bet Backfields That Refuse to Anoint a Workhorse