NFL QB Rushing Yards Props: Trading the Mobile Quarterback Market on UK Books
 Available in US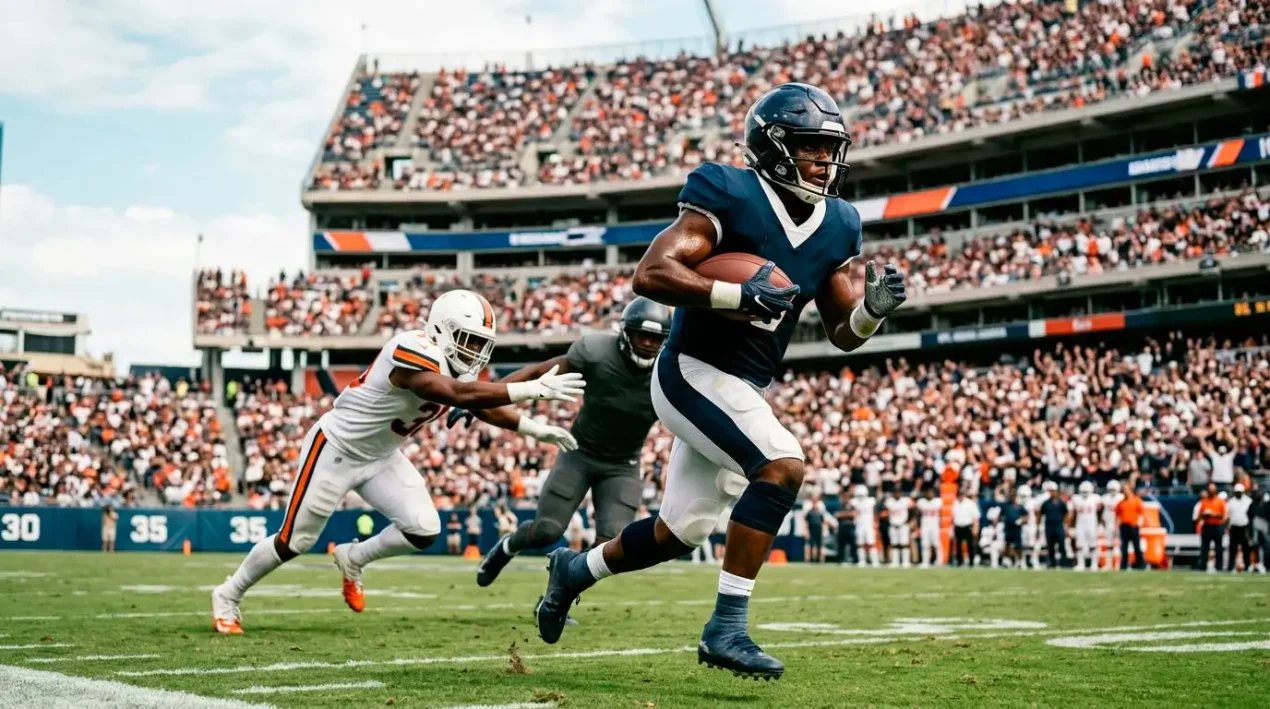
The 38-yard scramble that paid for the rest of the slate
A mobile QB I had been tracking for half a season was set at 24.5 rushing yards in a Sunday divisional matchup. I projected him at 38 to 45 based on the opposing defence’s coverage profile, the pass-rush quality, and his recent trend of escaping the pocket whenever the deep route concepts were not opening up. The over was offered at -115. By the third quarter he had 31 yards on five scrambles. By the end of the game he had 47, including a 22-yard run on a designed quarterback draw in the red zone. The over cashed comfortably and the same kind of read had cashed three of my four QB rushing-yard bets that month.
The QB rushing-yards market is one of the most consistently profitable prop categories I have run as a UK NFL bettor, and the structural reason is that the casual punter does not yet think of quarterbacks as rushing prop targets. The market exists, the lines are offered widely, but the public attention sits on the passing-yards line for the same player. That asymmetric attention is the gap a disciplined punter exploits.
What changed about the QB position
The mobile-quarterback population in the NFL has expanded substantially over the past several seasons. The number of starting QBs averaging 30 or more rushing yards per game has grown from a small handful a decade ago to roughly a third of the league’s starters today. Designed quarterback runs, RPO concepts, and scramble drills all contribute to the volume. The result is a market category that did not really exist as a serious betting product 10 years ago and now drives meaningful weekly handle on UK books.
The pricing on QB rushing-yards markets has not yet fully caught up with this shift. The implied volatility on a mobile QB’s rushing line is wider than on a comparable position’s primary stat, and bookmakers tend to set conservative central estimates with wide alt-line ladders. The conservative central estimate is exactly where the punter’s edge lives. A QB averaging 38 rushing yards per game with a 22 yard standard deviation will have his line set at 31.5 or 32.5 on most UK books, which prices an over at a generous probability for any spot where the defensive matchup is even modestly favourable.
The Pickswise prop ledger that ran to 59 winning props and +7.7 units across the regular season, wild card, divisional and conference rounds had a disproportionate contribution from QB rushing-yard plays. The hit rate on selective QB rushing overs ran in the mid-60s percent range across that sample, which is meaningfully above the break-even rate at standard prop pricing.
The defensive matchup variables that matter
The opposing defence’s behaviour is the most important matchup variable for QB rushing-yard props. Defences vary dramatically in their pass-rush aggressiveness, their gap discipline, and their willingness to spy the quarterback. The defences that produce the most QB rushing yards against are usually the high-pressure-rate defences with poor gap discipline – the schemes that send extra rushers but leave running lanes when those rushers do not get home.
The opposite profile – a defence with strong four-man pressure, disciplined gap assignments, and a designated spy – limits a mobile QB’s rushing production substantially. The QB’s rushing-yard line in such matchups is often appropriately depressed, and the under can be the cleaner play in those spots. The work for the bettor is identifying which defence sits in each category, which is publicly trackable through pressure rates, sack rates, and quarterback-scramble-yards-allowed metrics.
The compounding factor is pass-protection quality on the QB’s own team. A mobile QB behind a poor offensive line is rushing more out of necessity than design – the scrambles come from collapsed pockets rather than play-design choices. The yardage on those scrambles is more variable, because they can be tackled at the line of scrimmage as easily as they can break for 20-plus yards. A mobile QB behind a strong offensive line is rushing more on design – RPOs, planned runs, and zone-read keepers that have a much higher floor of expected yards per attempt.
The script-driven volatility
QB rushing yards are highly script-dependent, even more so than running back rushing yards. A mobile QB whose team is favoured by 6 points and ends up leading by 14 in the third quarter typically does not run aggressively in the fourth, because the team is in clock-killing mode and the QB is being protected from injury risk. The same QB whose team is trailing by 10 in the fourth quarter is scrambling on every play to extend drives.
The implication is that the cleanest QB rushing-yards over spots are games where the team is projected to play from behind or in tight back-and-forth scripts. Heavy favourites with mobile QBs are structurally underwhelming bets on QB rushing-yards overs, because the script protection in the fourth quarter caps the volume. Heavy underdogs with mobile QBs are excellent over bets, because the script forces aggression and the QB’s mobility becomes the primary offensive weapon.
The 2025 international games drew an average 6.2 million viewers across NFL Network broadcasts, a 32% increase on the prior year, and a notable share of that growth has been driven by storylines around mobile quarterbacks. The dual-threat QB has become the brand of modern NFL marketing, which means the public attention on these players’ rushing numbers has grown faster on the casual-fan side than the analytical-bettor side. Henry Hodgson, the NFL UK GM, framed the growth picture: “There’s a lot of growth, and the UK is at the centre of that international growth as well.” That asymmetric attention is the gap the disciplined punter exploits.
The red-zone rushing TD angle
The most consistently mispriced QB rushing market is not the standard rushing-yards line – it is the anytime-rushing-TD market for mobile QBs. The implied probability on a mobile QB rushing for a touchdown in any given game is often priced in the +180 to +280 range, which implies a 26% to 35% probability. The true probability for a top-tier rushing QB in a plus-matchup spot is often closer to 35% to 45%, particularly when the team is projected to reach the red zone three or more times.
The structural fact: 24 of the last 35 Super Bowls have featured a touchdown scored from the 1-yard line, around 60% of championship games, and the trend toward goal-line QB sneaks and designed QB runs has accelerated in recent seasons. Mobile QBs in particular have become the preferred goal-line option for many coaching staffs, because the QB sneak with a mobile threat is harder to defend than with a pocket QB.
The market response to this trend has been partial. The QB rushing-TD prices have shortened somewhat for the most established rushing QBs, but the second tier – QBs who are mobile but not yet labelled as primary rushing threats – are often priced as if they were pure pocket passers. The over on the rushing-TD prop for these QBs is one of the cleaner inefficiencies remaining in the standard prop market.
The longest-rush alt line
The longest-rush alt line for mobile QBs is a market that exists on a subset of UK books and rarely receives the same line-tightening attention as the standard markets. The line is typically set in the 12 to 18 yard range for top-tier rushing QBs, and the implied probability of clearing it is often priced as if the QB’s rushing yardage is evenly distributed across his attempts. In practice, mobile QB rushing yardage is bimodal – most attempts gain 3 to 6 yards, but a meaningful share of attempts go for 15-plus, especially on scrambles and broken plays.
The compounding factor is that the longest-rush line tends to cluster around the alt-line decision threshold for the bookmaker, which means small movements in the QB’s expected attempts can swing the implied probability sharply. A QB projected for 7 attempts averaging 6.5 yards each has a different longest-rush distribution from a QB projected for 12 attempts at 4.5 yards each, even though the total rushing-yards projections are similar.
The longest-rush over is most attractive when the QB is in a high-scramble script (poor pass protection, deep coverage by the defence) rather than a high-design-run script (planned RPOs and zone reads in a controlled offence). Scramble-driven rushing yardage has a higher per-attempt variance and a longer right tail, which is exactly the shape that makes the longest-rush alt line valuable.
The bet selection workflow for QB rushing markets
My weekly QB rushing workflow starts on Friday with the matchup-defence cross-reference. I pull the opposing defence’s quarterback-scramble-yards-allowed and pass-rush pressure rate metrics, and identify the matchups where a mobile QB faces a defence in the bottom third of either metric. Those are the candidate over spots. I then cross-reference against the team’s offensive pass-protection quality – strong pass protection with a mobile QB is the cleanest profile, because the rushing yardage will come from designed runs rather than purely scramble-driven volume.
The Friday short-list typically has four to six candidate plays. Through the weekend, the lines may move based on injury reports for the opposing defence’s key pass-rushers and spies. I lock my selections on Saturday evening and rarely adjust through Sunday morning unless a clear lineup change emerges. The Sunday morning inactives can sharpen a spot – if the opposing defence’s primary spy linebacker is downgraded, the QB rushing over becomes more confident – but they rarely create new spots from nothing.
The sizing discipline matches the variance profile of QB rushing markets. Standard rushing-yards overs at 2% of bankroll per play. Rushing-TD plays sized smaller, at 1% to 1.5%, because the variance is higher. Longest-rush alt lines at 1%, with the option to spread the position across two or three alt thresholds when multiple alt lines look mispriced. Across a season, the QB rushing-yard category typically delivers a positive return on around 35% of total prop stakes deployed, with a hit rate in the 60% to 65% range when filtering is disciplined.
How do I project a mobile QB’s rushing yards against a specific defence?
The two primary inputs are the opposing defence’s quarterback-scramble-yards-allowed metric and their pressure rate. A defence below league average on scramble yards allowed, combined with a top-quartile pressure rate, suggests a structurally tight matchup that compresses the QB’s rushing yard expectation by 8 to 12 yards relative to his season average. A defence in the bottom quartile on scramble yards allowed, combined with poor gap discipline, suggests an expansion of 10 to 18 yards relative to the season average. The script projection then adjusts on top of the matchup base.
Is the QB rushing TD market a better play than the QB rushing yards market?
It depends on the matchup. For top-tier mobile QBs who are also the team’s primary short-yardage option, the rushing-TD market is often more inefficiently priced because casual punters under-rate goal-line QB sneaks. The implied probability frequently sits 5 to 10 percentage points below the true probability in plus-matchup spots. For mobile QBs who are not goal-line options, the rushing-yards market is the cleaner play, because the touchdown variance is driven by team play-calling rather than the QB’s underlying mobility.
If QB-rushing thinking sharpens your interest in alt-line ladders generally, the related read is how alt-line strategy creates parallel betting paths across UK prop markets.
This material was created by the YardLedger team.
Related posts

Passing Yards Prop Strategy for NFL: Reading Lines, Pace and Defensive Context
NFL RB Committee Prop Strategy: How to Bet Backfields That Refuse to Anoint a Workhorse